3.1. Climate homeostasis: Evidence for climate stability on Earth#
Professor: Ed Tipper (Earth Sciences)
Learning Objectives:
The role of Greenhouse Gases in controlling climate
Climate on neighbouring planets
Sedimentary evidence for a stable climate on Earth
Mineral evidence for stable climate on Earth
The faint young sun paradox
Stable isotope evidence and controversy for climate stability.
The physical and chemical parameters (both internal and external) on Earth conspired to allow a narrow range of environmental conditions at its surface that have made it habitable throughout much of its history and allow life to develop. These three lectures review some of the evidence and hypotheses for the controls on climate over Earth’s 4.5 billion year history.
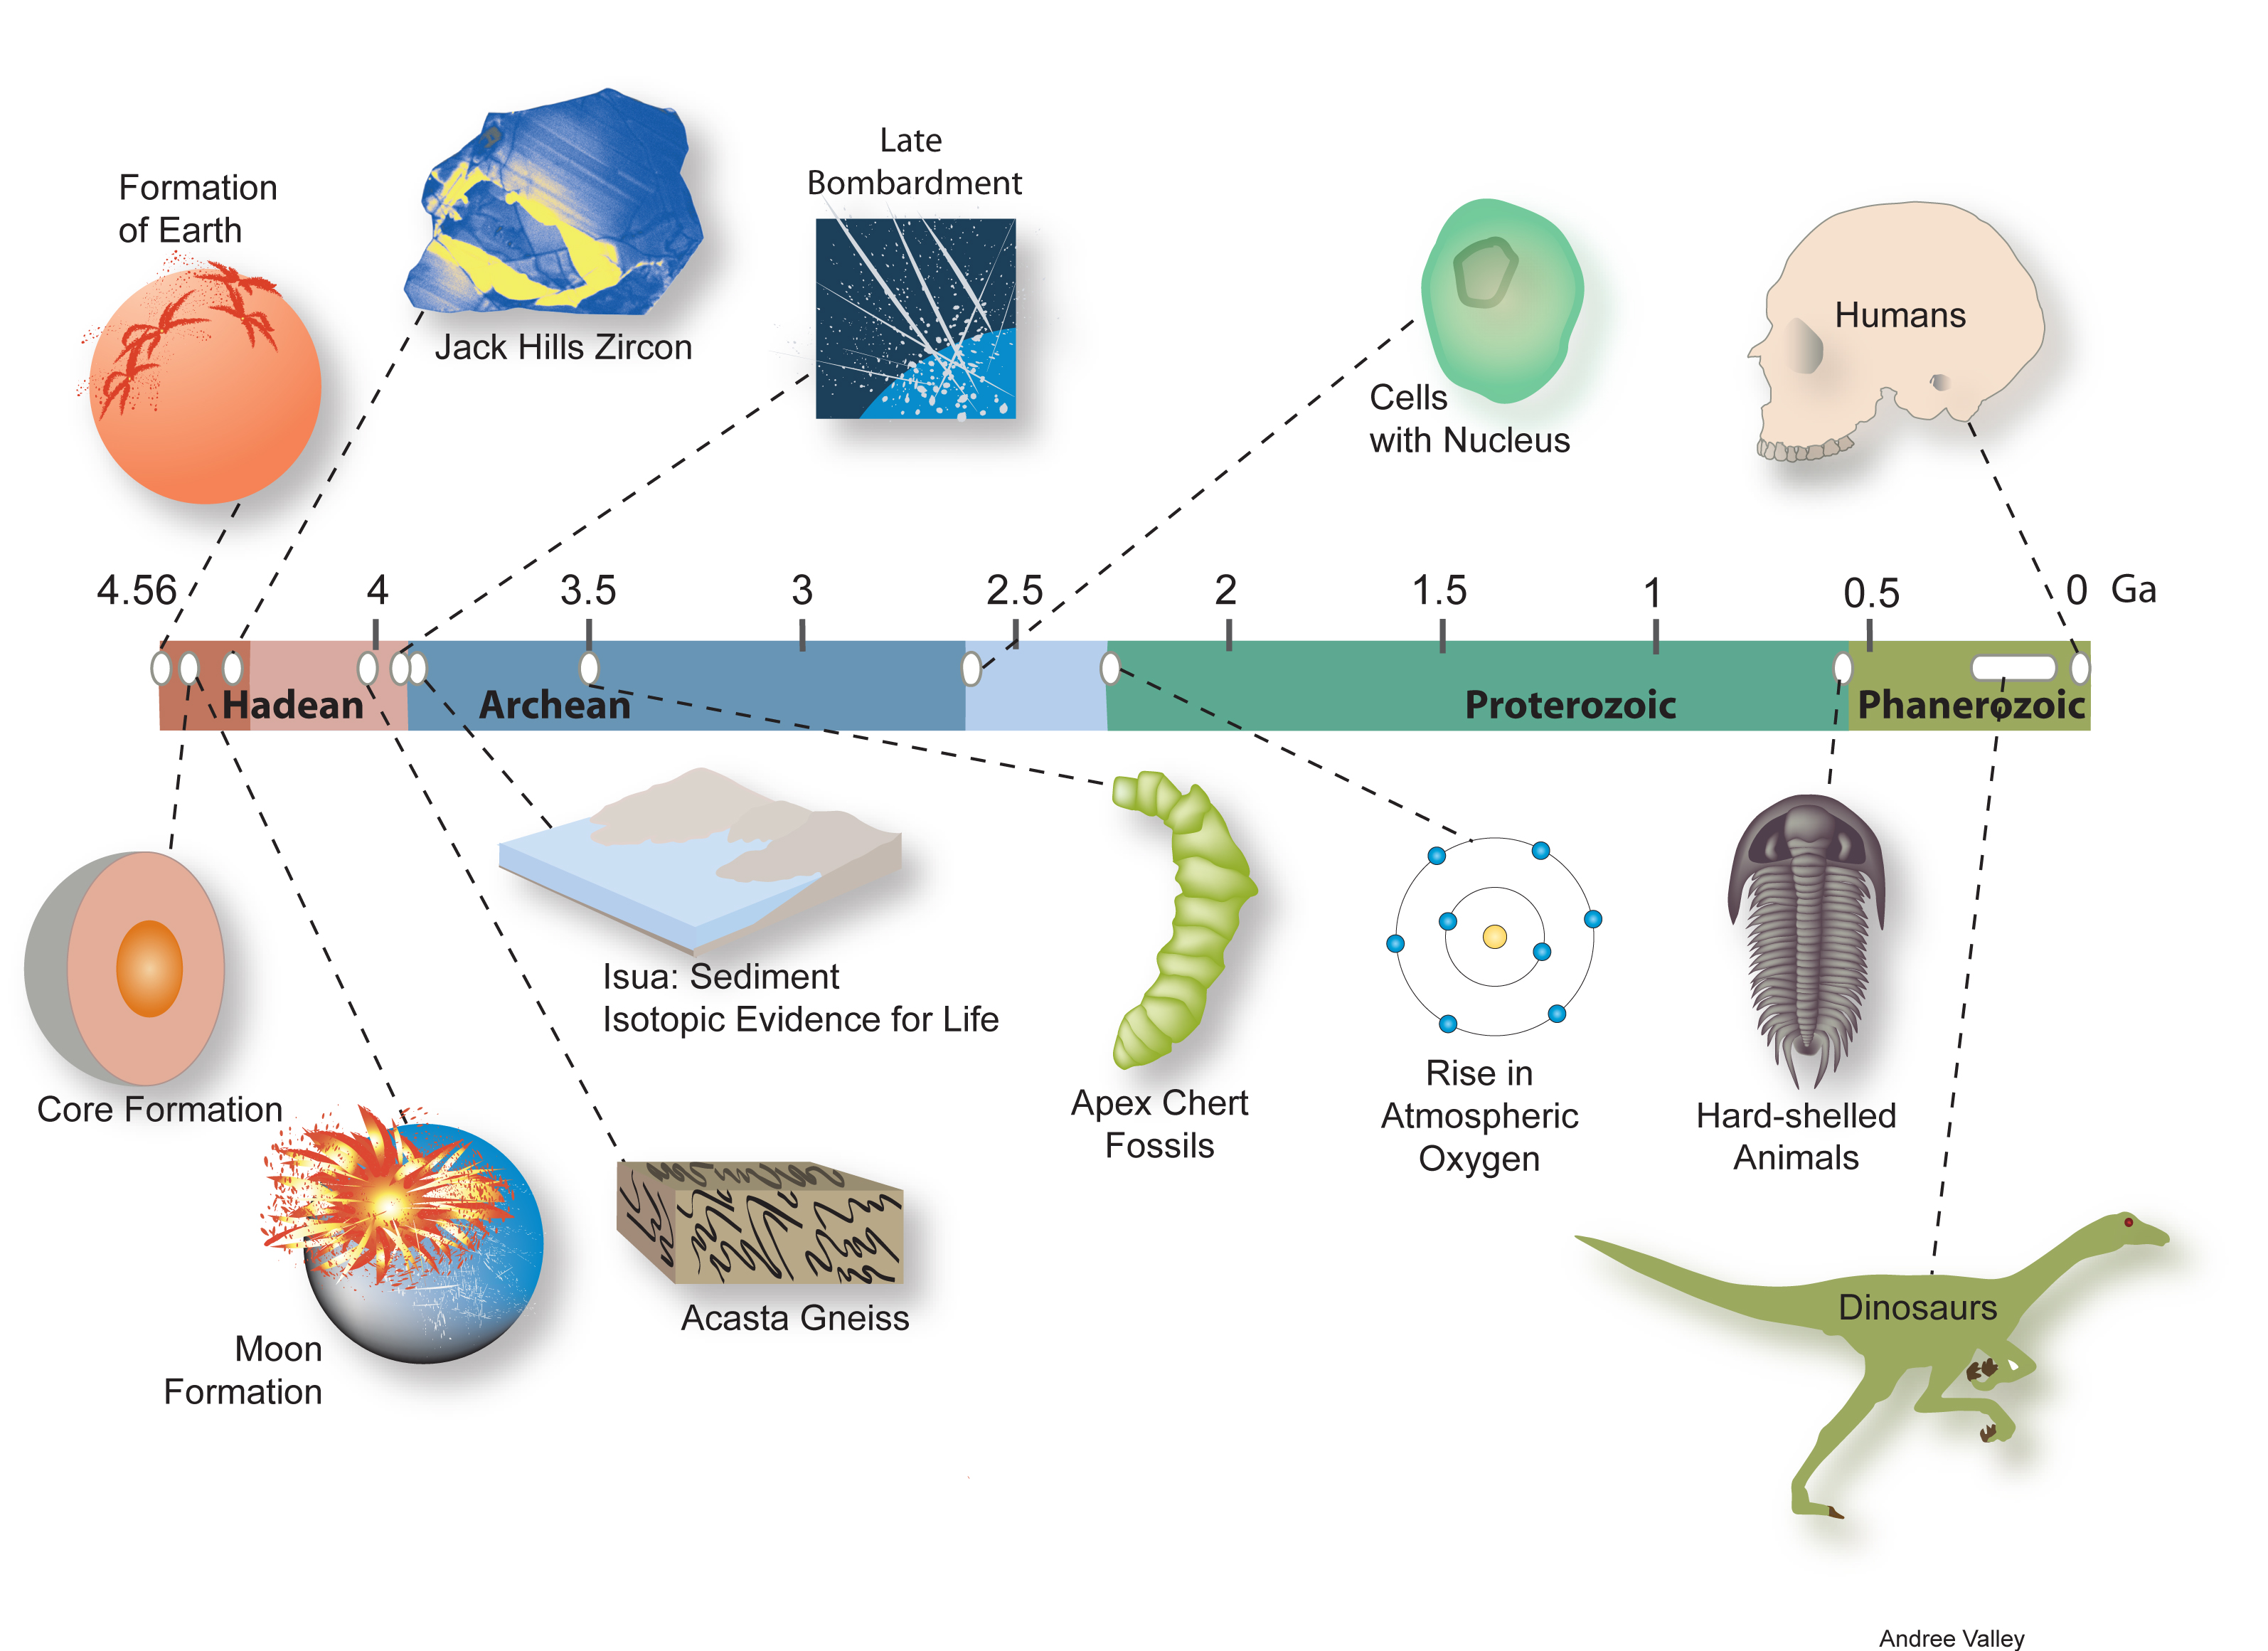
Fig. 3.2 An elementary timeline of the history of planet Earth Image Credit: Andree Valley.#
Climate controls our everyday lives. Barely a day will go by without some aspect of climate being in the media. The vast majority of the scientific literature and media focuses on climate change and climate instability with most science considering our rapidly changing world. Stepping back, and considering climate a planetary scale and over the entire Earth History, there is a a different perspective, one of climate stability or climate homeostasis.
A brief revision on the role of Greenhouse Gases in controlling climate#
Earth’s radiation balance#
Over the years improvements in estimating the global annual mean energy budget have resulted from satellite observations.
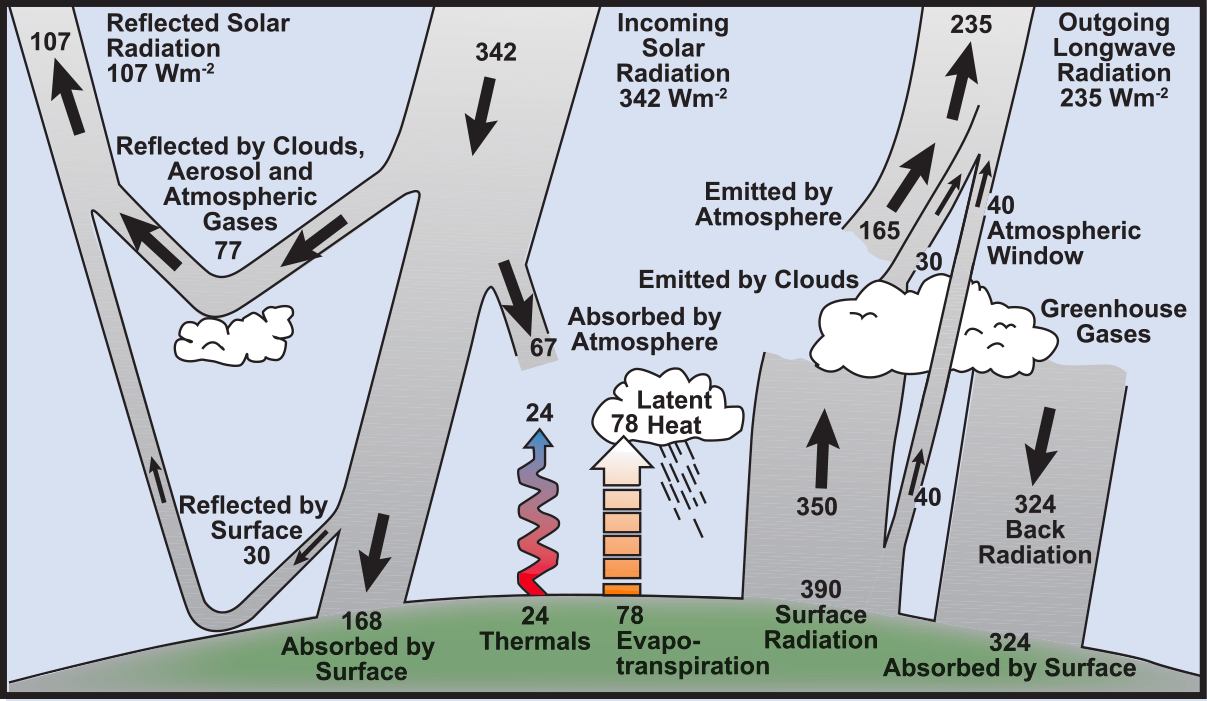
Fig. 3.3 Earth’s radiation balance from the IPCC report.#
The amount of energy reaching the top of Earth’s atmosphere each second averaged over the entire planet is approximately 342\(\sf Wm^{-2}s^{-1}\) Fig. 3.3. About 30% of the sunlight that reaches the top of the atmosphere is reflected back to space. Roughly two-thirds of this reflectivity is due to clouds and small particles in the atmosphere known as aerosols. Light-coloured areas of Earth’s surface, mainly snow, ice and deserts reflect the remaining one-third of the sunlight. The most dramatic change in aerosol-produced reflectivity comes when major volcanic eruptions eject material very high into the atmosphere.
Rain typically clears aerosols out of the atmosphere in a week or two, but when material from a violent volcanic eruption is projected far above the highest cloud, these aerosols typically influence the climate for about a year or two before falling into the troposphere and being carried to the surface by precipitation. Major volcanic eruptions can thus cause a drop in mean global surface temperature of about half a degree celsius that can last for months or even years. Some man-made aerosols also significantly reflect sunlight.
Earth’s atmosphere and Greenhouse gases#
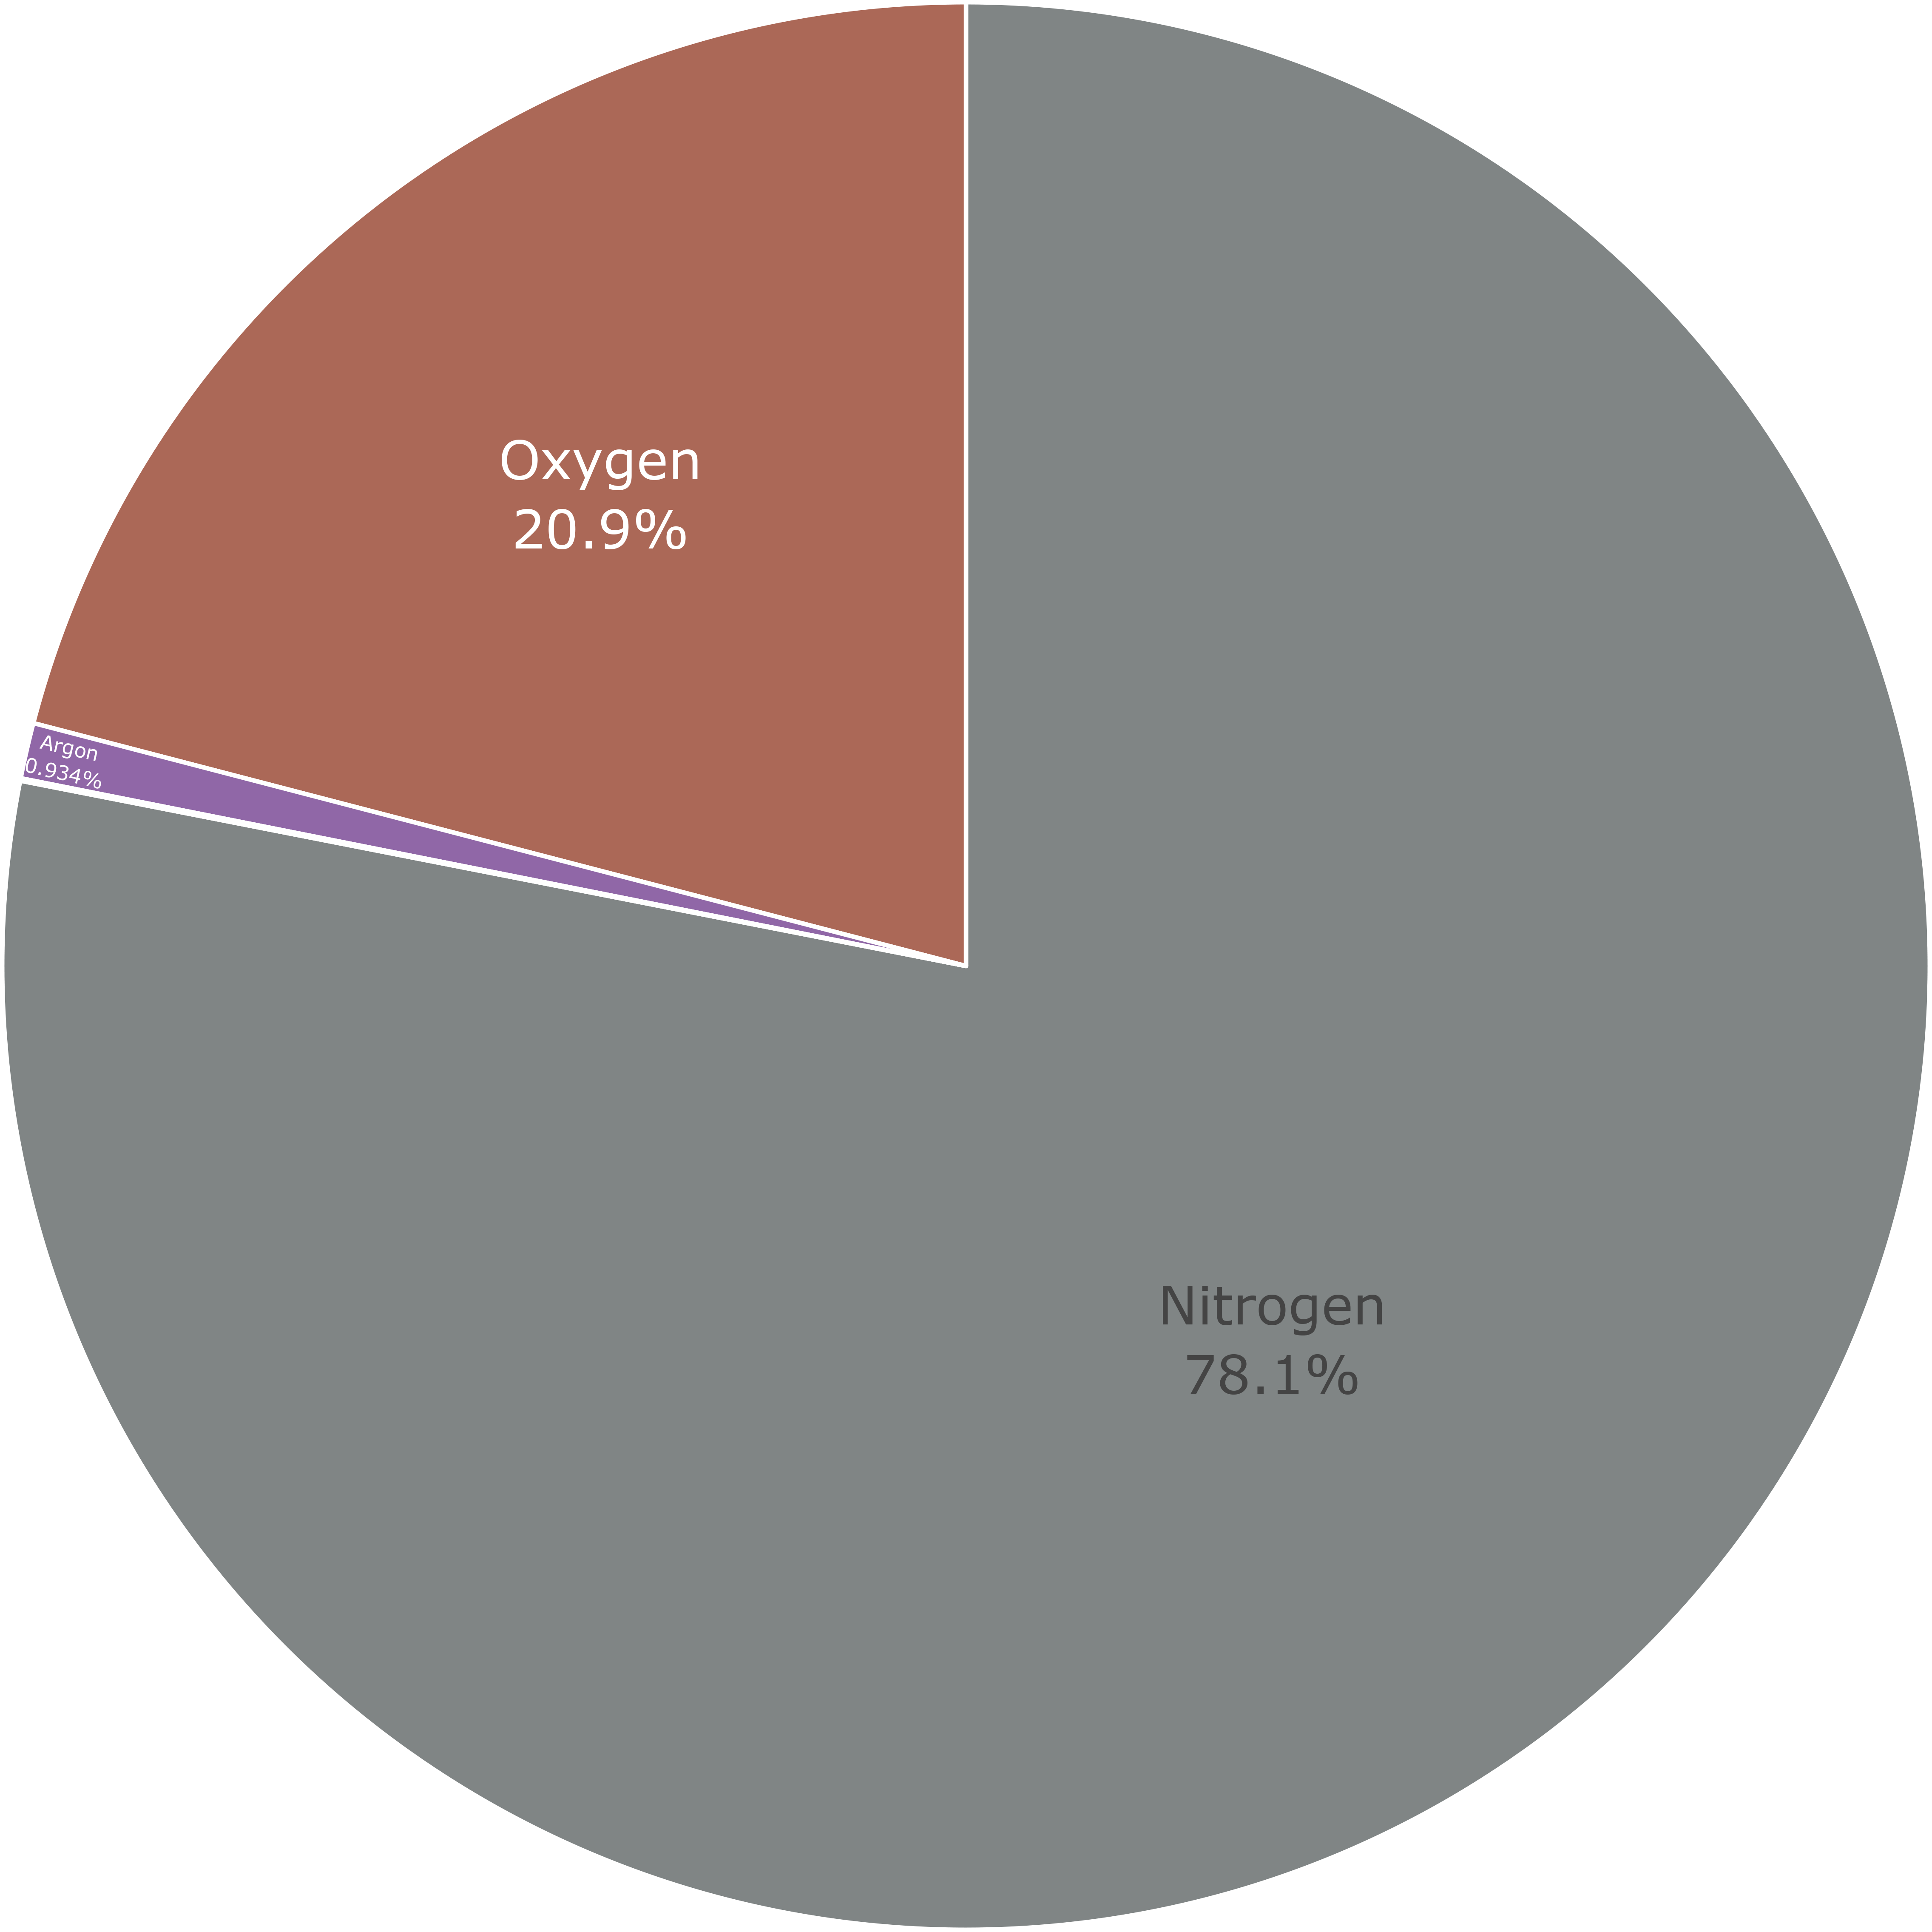
Fig. 3.4 The main constituants of Earth’s atmosphere, \(\sf N_2\) and \(\sf O_2\). The minor purple component is mainly argon and all other trace gases.#
Greenhouse gases such as \(\sf CO_2\) only consitute a minor fraction of the total composition of the atmosphere on Earth Fig. 3.4 but they are are crucial to climate.
The greenhouse effect is thought to be critical to the balance of radiated longwave radiation Fig. 3.3. Note that water vapour has approximately twice the influence of \(\sf CO_2\) because although a less efficient greenhouse gas, it is a factor of 10 more concentrated that \(\sf CO_2\) in the atmosphere Table 3.1.
Gas |
Concentration % |
Individual contribution |
Combined with overlap effects |
Percent contribution clear sky |
|---|---|---|---|---|
Wm\(^{-2}\) |
Wm\(^{-2}\) |
Wm\(^{-2}\) |
||
\(\sf H_2O\) |
0.4 |
71 (49) |
75 (51) |
60 |
\(\sf CO_2\) |
0.039 |
29 (22) |
32 (24) |
26 |
\(\sf CH_4+N_2O\) |
2 10\(^{-4}\) |
8 (4) |
8(4) |
6 |
\(\sf O_3\) |
7 10\(^{-6}\) |
8 (7) |
10 (7) |
8 |
A simple energy balance#
The energy balance for a planet is derived by equating the incoming energy from the sun and the outgoing energy lost to space. “Blackbody radiation” refers to an object that absorbs all radiation incident upon it and perfectly reradiates energy as a function of its temperature. This energy balance can be used to estimate the temperature and is the basis for the following equation:
\(\sigma\) is the Stefan-Boltzmann constant,
\(\epsilon\) the effective surface emissivity,
A the wavelength-integrated Bond albedo,
S the solar constant at the planet’s distance from the sun.
Note, expressing in terms of the solar constant cancels out the semi-major axis, \(a\), from the above expression.
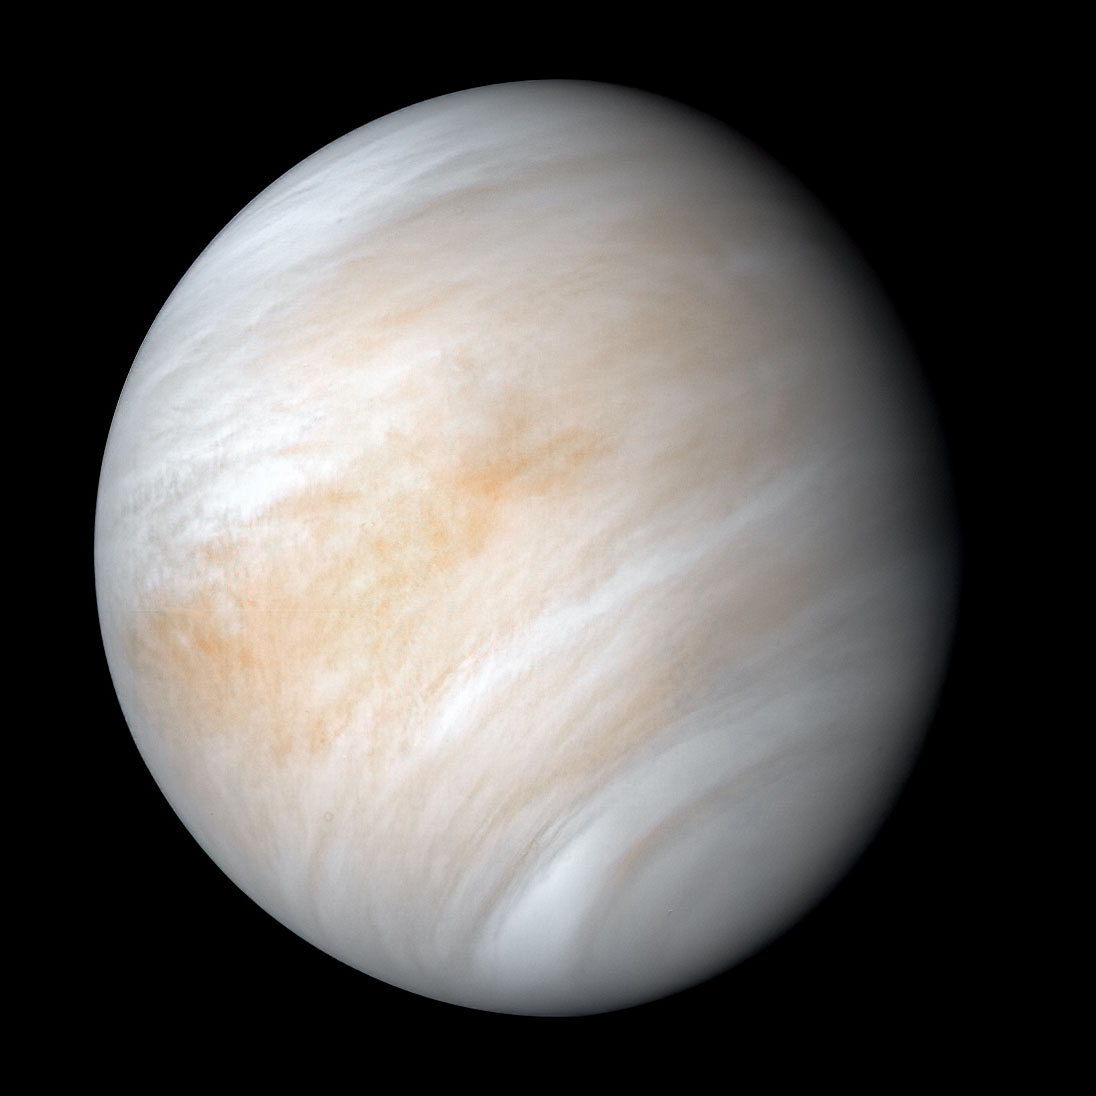
Fig. 3.5 Venus captured by the Mariner 10 spacecraft. It is wrapped in a dense, global cloud layer. The clouds seen here are located about 60 kilometers above the planet’s surface and are comprised of sulfuric acid particles. Image Source: Nasa.#
For Earth today, \(\sf T_e\) (the equilibrium temperature at the surface of the Earth) is ~255 K. The difference \(\sf \Delta T\) of 33 K between \(\sf T_e\) and the observed mean surface temperature \(\sf T_s\) is due to the mainly \(\sf H_2O-CO_2\) atmospheric greenhouse effect.
Fig. 3.6 The main constituents of Venus’s atmosphere, \(\sf CO_2\) and \(\sf N_2\).#
There is much to learn about climate stabilitity past present and future on Earth by comparing with the atmospheres of our neighbouring planet Venus and Mars.
Planets with a runaway greenhouse#
Venus’s (Fig. 3.5) atmosphere is “thick” and made up of mostly carbon dioxide, with some nitrogen and traces of other gases (Fig. 3.6). Venus is only slightly smaller than Earth and may still have volcanic activity today [this could be important for atmospheric composition via degassing]. It is thought that its surface has been resurfaced with lavas in the last 500 million years. It is not thought to be tectonically active, and its volcanoes were likely powered by thermal plumes rising through the mantle analagous to the mantle plumes on Earth. The thick noxious atmosphere on Venus has caused a “runaway greenhouse”, with surface temperatures estimated at 470\(^\circ\)C. The high atmospheric pressure and temperature make it extremely difficult to carry out long-duration missions at Venus’s surface. Because of the greenhouse effect, surface temperatures are hotter than planet Mercury, which orbits closer to the Sun. The stark difference between Venus and Earth is often used as an example of what happens in a runaway greenhouse effect.
Planets without a greenhouse effect#
Fig. 3.7 Martian atmosphere composition; public domain. Image Credit: NASA/JPL-Caltech, Sample Analysis at Mars (SAM)/GSFC)#
Mars is much smaller than Earth and Venus, and as a result cooled more quickly. When its volcanoes became extinct it lost a key means of replenishing its atmosphere (though Mars still boasts the largest volcano in the entire Solar System the 25 kilometre high Olympus Mons), likely too the result of continuous vertical building of the crust from plumes rising from below. Even though there is evidence for tectonic activity within the last 10 million years, and even the occasional marsquake in present times, the planet is not believed to have an Earth-like tectonics system either.
Mars’ present atmosphere (Fig. 3.7) is so thin that although carbon dioxide condenses into clouds, it cannot retain sufficient energy from the Sun to maintain surface water – it vaporises instantly at the surface. But with its low pressure and temperatures of -55ºC (ranging from -133ºC at the winter pole to +27ºC during summer), spacecraft have landed revealing much about the Martian surface. Because of the lack of recycling plate tectonics on the planet, four billion year old rocks are directly accessible to our landers and rovers exploring its surface. There is evidence for there having been liquid water on the Martian surface.
Natural Climate Oscillations on Earth#
Climate shows natural oscillations at different time-scales (from \(10^8\) to \(10^3\) years) that are revealed either by paleo-oceanographic records (typically sediment core or ice cores, Fig. 3.8). Distinguishing the root cause of these natural trends is not trivial even in the relatively recent past (it goes beyond simple greenhouse forcing) but is fundamental to understanding Earth’s climate system. For example, in ice core records CO2, methane and temperature all covary Fig. 3.8 on time-scales of ~20ky.
Fig. 3.8 Records of climate from Antarctic ice-cores.#
The detail of why this is the case is beyond the scope of this course. It relates to both changes in the incoming solar radiation related to Earth’s orbital parameters in addition to the coupling of the ocean atmosphere system. It is probably unlikely that the changes in greenhouse gas concentration are the only control on the temperature changes on this time-scale [food for thought!].
There are also changes in Earth’s climate over longer-timescales Fig. 3.9. Of note is the significant change over the last 65Myr, where the geological record appears to demonstrate significant cooling.
Fig. 3.9 The record of temperature on Earth from the last 550Myr. Note the changes in scale on the x-axis. Figure source: Glen Fergus.#
Evidence for Earth’s stable climate#
Fig. 3.10 Geological time-scale, a reminder.#
Whilst there are clearly variations in Earth’s temperature over geological time, they are relatively small, for example ~20C over the last 500 million years of Earth history. Even in the Earth’s earliest geological past, there is evidence for an equible climate. We review several lines of evidence for this over the entirety of planetary history.
The sedimentary record#
Clastic sedimentary rocks are those that have formed by transport of “grains” by a fluid, either water or air.
The oldest rocks on Earth#
The rock record strongly suggests that Earth’s temperature has remained within a temperature range that is less than 100C and greater than 0C such that liquid water has been sustained at the planetary surface. Some of the oldest rocks on the planet, such as those. from Isua in Greenland or those from the Barbeton belt in S. Africa are sedimentary, containing rounded clasts that could only have formed by mechanical erosion in water.
The Isua Greenstone Belt.#
The Isua Greenstone Belt is an Archean greenstone belt in southwestern Greenland, aged between 3.7 and 3.8 billion years (based on zircon ages). The geology is very complex, comprising variably metamorphosed volcanic and sedimentary rocks. It is the largest exposure of Eoarchaean supracrustal rocks on Earth and has been widely studied, though not without controversy.
Two lines of evidence suggest that at least some of the rocks formed in the presence of liquid water. Firstly, the the mafic metavolcanics include pillow lavas and pillow breccias, which indicate that the lavas erupted subaqueously, and requires the presence of surface water during the Eoarchaean [Note that these are not actually sedimentary rocks].
Secondly, there is “clear” evidence for clastic sedimentary rocks which can only have formed by the transport of clasts or grains in water.
Fig. 3.11 Field photograph of cross bedding from the Isua Greenstone Belt. Image Credit: Webb et al 2020#
The Barberton Greenstone Belt.#
The Barberton Greenstone Belt comprise a complex series of rocks, including sedimentary rocks, ranging in age from \(\lt\) 3.547 to \(\gt\)3.219 Ga The age constrains are mainly derived from high-precision zircon U-Pb dating of interbedded volcanic units and plutons, as well as detrital zircon geochronology. There are a series of both chemical and detrital sediments.
Fig. 3.12 Photo micrograph of cross bedding from the Barberton Greenstone Belt Homann, 2019. Cross bedding is a clear indicator of sedimentary deposition.#
The oldest minerals on Earth show evidence for liquid water#
Fig. 3.13 A Zircon mineral from Jack Hills viewed under Cathodoluminesence from Image Credit: John Valley.#
Earth’s earliest history is referred to as the Hadean eon. Meteorite impacts and magma oceans maintained high surface temperatures at or above the temperatures where surface water vaporized to a dense steam atmosphere. Little is known of the early Earth because of the absence of a rock record for the first 500 million years after accretion. However, the oldest minerals predate the oldest rocks. These minerals (magmatic zircons) demonstrate not only that there must have been a buoyant crust on Earth as early as 4400 Ma, but also that liquid water must have interacted with that crust.
The zircons have been dated using radiometric dating (the U-Pb method). The only unequivocal U-Pb ages extending into the Hadean are ancient >4000 Ma zircon grains that are dominantly found as detrital grains in Archean rocks from Western Australia.
Further geochemical analysis of the zircons has provided detailed information about their origin. The chemical element oxygen has three isotopes \(\sf ^{16}O\), \(\sf ^{17}O\) and \(\sf ^{18}O\). Analysis of the relative amounts of \(\sf ^{16}O\), and \(\sf ^{18}O\) expressed as \(\sf \delta^{18}O\) indicates that the zircons are enriched in \(\sf ^{18}O\). This is likely caused by the zircons having crystalised from a melted rock that has undergone water-rock interaction at low temperature. Thus, the magma that eventually gave rise to the zircons might have been formed from what had once been sediments deposited on the floor of an ancient ocean.
The implication for Earth’s climate is that there must have been liquid water at the surface of the Earth.
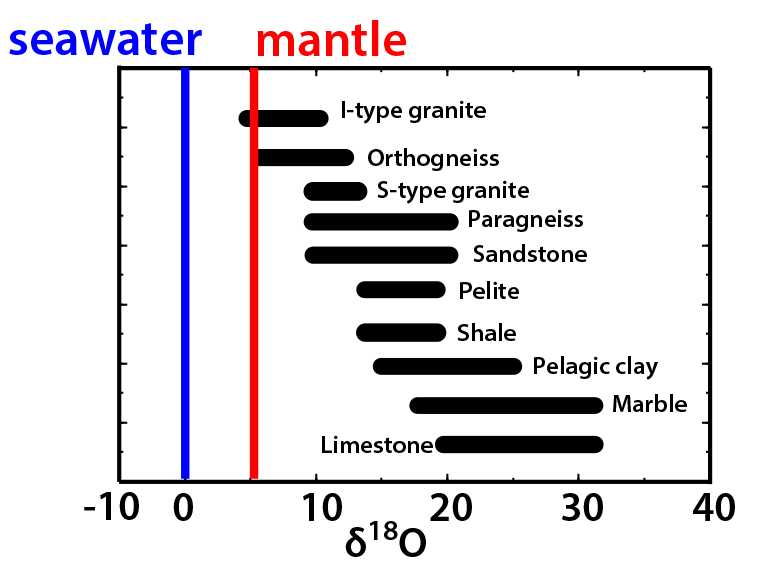
Fig. 3.14 Summary of oxygen isotope variability on Earth, expressed as \(\delta^{18}O\).#
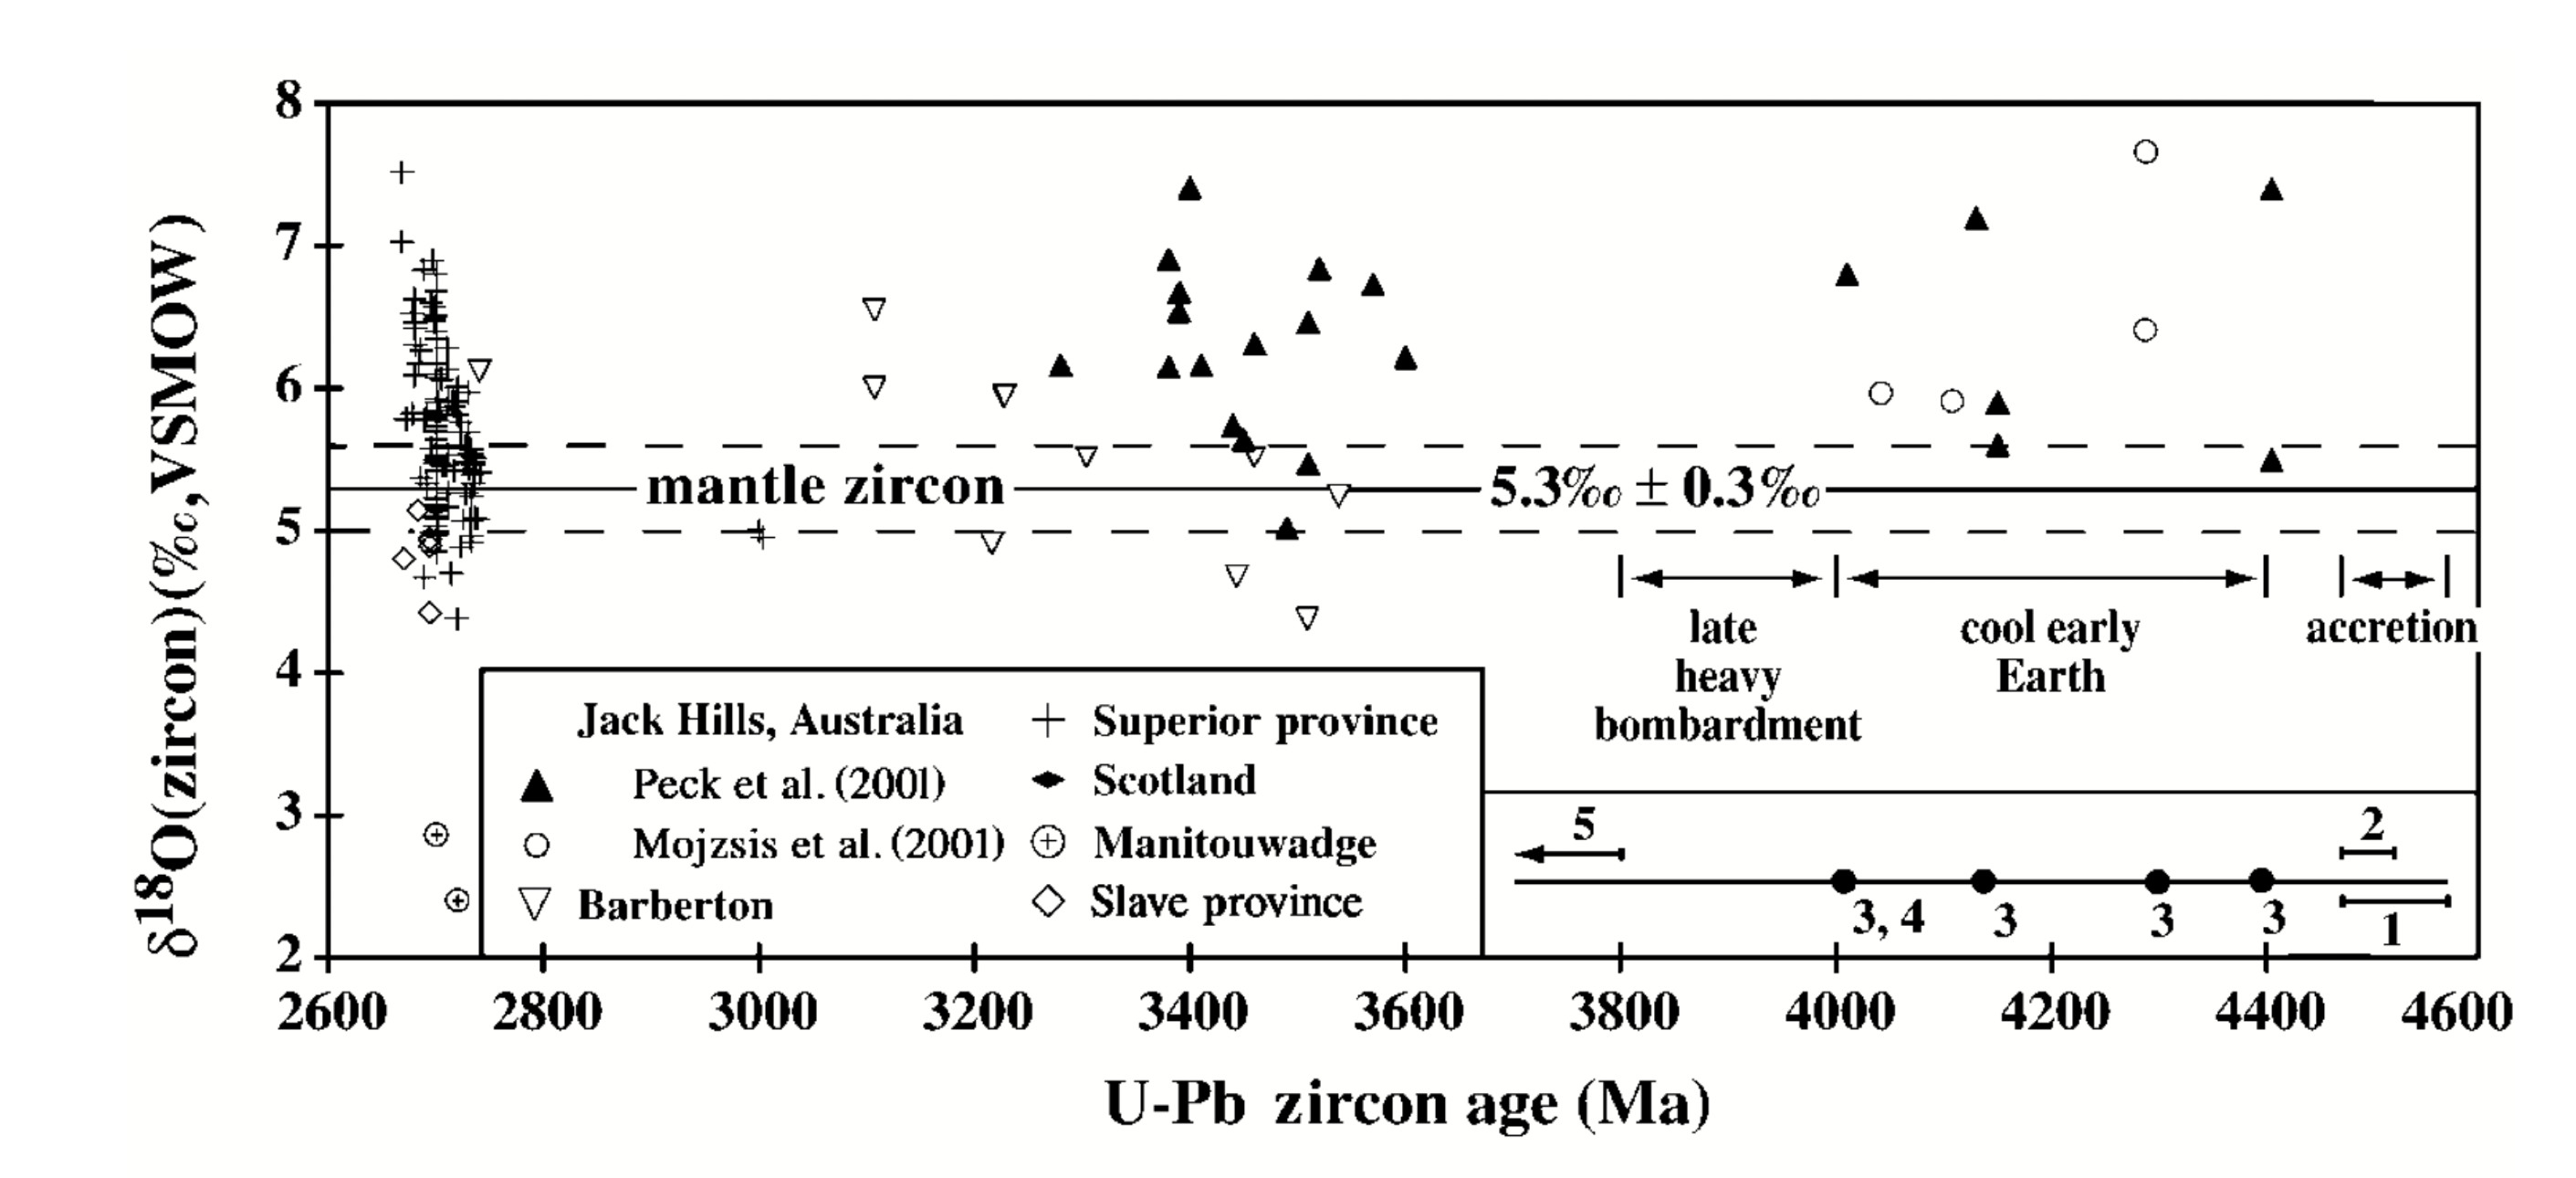
Fig. 3.15 The \(\sf \delta^{18}O\) of zircons through time, from Valley et al, 2002.#
The faint young sun paradox#
Standard models for the evolution of the Sun predict that 4.5 billion years ago, when Earth was newly formed, the Sun was 30% less luminous than it is today. Based on the same radiation balance (3.1), the Earth’s surface should have been frozen, implying that the greenhouse effect in the eariest Earth history, was stronger than today. Presumably this was acheived by higher rates of solid Earth degassing.
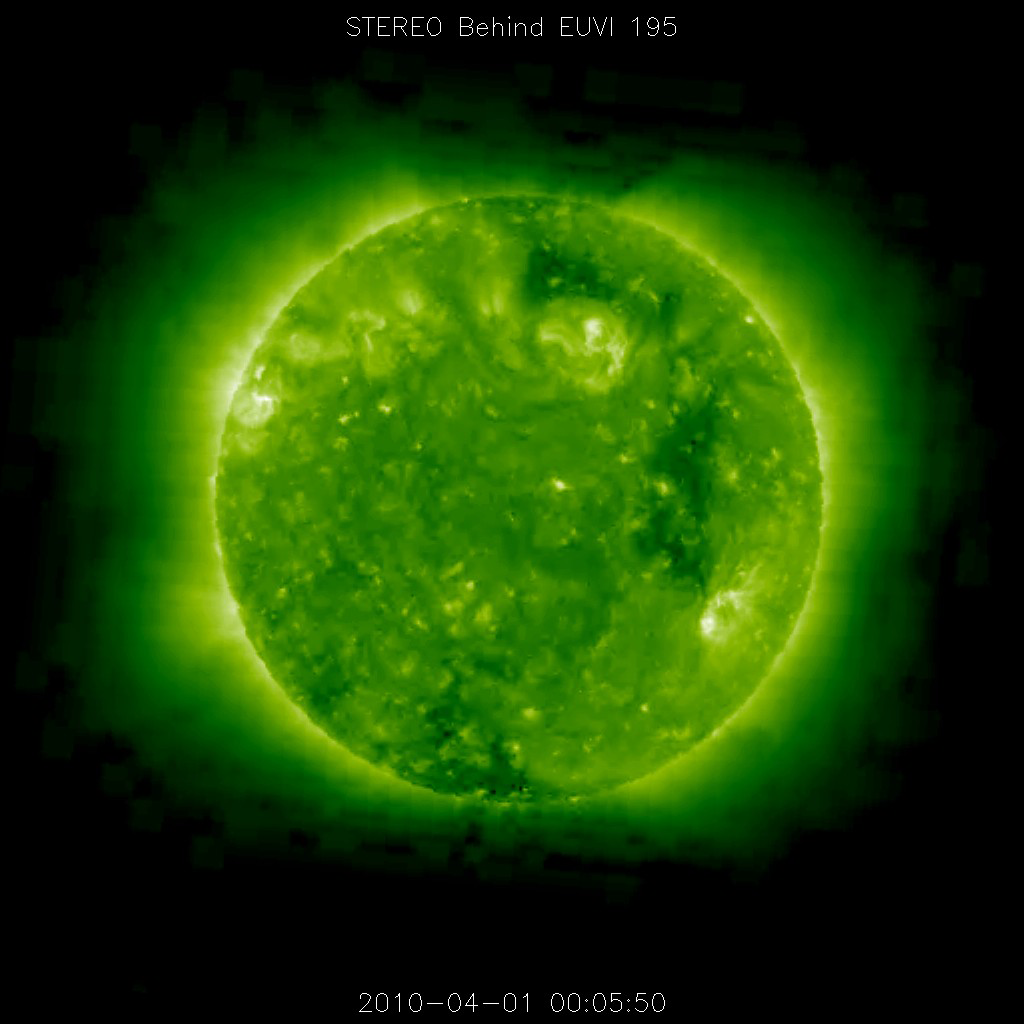
Fig. 3.16 A filament erupted on the backside of the sun and was observed by the EUVI instrument on the STEREO Ahead spacecraft. Image credit: www.thesuntoday.org#